Thursday, 19 December 2013

Protein Data Bank(PDB)

Assalamualaikum,

Welcome everybody,today we would like to explain about Protein Data Bank.

The Protein Bank (PDB) is a repository for the three-dimensional structural data for large biological molecules, such as proteins and nucleic acids. The data, typically obtained by X-ray crystallography or NMR spectroscopy and submitted by biologists and biochemists from around the world.

X-Ray Crystallography

  • A target is selected for structure determination
  • The material is purified and then crystallized
  • Crystals are put in front of an X-ray beam and diffracted intensities are collected on a detector
  • These data are then analyzed using different computational methods


Data Deposition

PDB Extract Tool
  • pdb_extract can extract information from the output of standard crystallographic programs.
  • It merges the information into mmCIF files at each step of the structure-determination process.
  • These mmCIF are then ready for validation and deposition.
AutoDep Input Tool
  • ADIT is used for assembling, editing, validating and deposition structural data.
  • It is built on top of the mmCIF dictionary.
PDB Validation Suite
  • Creates reports based upon the validation results.
  • Also calculates derived information that could be used for assessing the quality of a structure.

For more information on process of data deposition,click here.


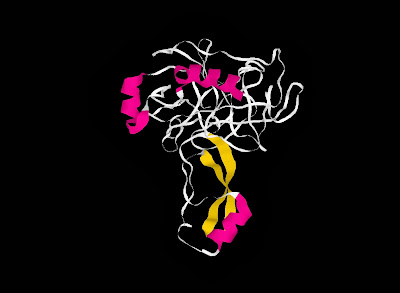
Examples of protein structure images with their description:


ALPHA-AMYLASE FROM BACILLUS SUBTILIS COMPLEXED WITH MALTOPENTAOSE


ClassificationAlpha amylase
Structure weight48016.77
MoleculeALPHA-1,4-GLUCAN-4-GLUCANOHYDROLASE
Polymer1
TypeProtein
Length425
ChainsA
OrganismBacillus subtilis


THE GEOMETRY OF THE REACTIVE SITE AND OF THE PEPTIDE GROUPS IN TRYPSIN, TRYPSINOGEN AND ITS COMPLEXES WITH INHIBITORS


ClassificationComplex (proteinase/inhibitor))
Structure weight29892.08
MoleculeBETA-TRYPSIN
Polymer1
TypeProtein
Length223
ChainsE
OrganismBos taurus


X-RAY ANALYSES OF ASPARTIC PROTEASES. II. THREE-DIMENSIONAL STRUCTURE OF THE HEXAGONAL CRYSTAL FORM OF PORCINE PEPSIN AT 2.3 ANGSTROMS RESOLUTION


ClassificationHydrolase(acid Proteinase)
Structure weight34469.80
MoleculePEPSIN
Polymer1
TypeProtein
Length326
ChainsA
OrganismSus scrofa


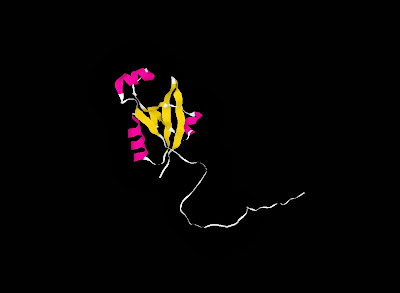
SOLUTION STRUCTURE OF HTRA PDZ DOMAIN FROM STREPTOCOCCUS PNEUMONIA


ClassificationProtein Binding
Structure weight14890.90
MoleculePutative serine protease
Polymer1
TypeProtein
Length134
ChainsA
OrganismStreptococcus pneumoniae


CRYSTAL STRUCTURE OF BOVINE PANCREATIC CARBOXYPEPTIDASE A COMPLEXED WITH AMINOCARBONYLPHENYLALANINE AT 1.75 A


ClassificationCarboxypeptidase
Structure weight138865.59
MoleculeCARBOXYPEPTIDASE A
Polymer1
TypeProtein
Length307
ChainsA, B, D, E
OrganismBos taurus

SMILES

Assalamu'alaikum.

Welcome to the geniuses lair, everybody. Today we are going to learn about SMILES.

SMILES is Simplified Molecular-Input Line-Entry System. This program is used to translate a chemical three-dimensional structure into a string of symbols that is easily understood by a computer software.
SMILES is a easily-learned and flexible notation. The SMILES notation requires us to learn a handful of rules.

For example, this Morphine structure. I will demonstrate the function of this program by using this example.

Smiley face

By using SMILES you can translate the above structure which is Morphine CAS RN 57-27-2, into linear representation of the molecule so that a computer program can understand the structure.

Here is one SMILES Notation for CAS RN 57-27-2
Oc1ccc2CC(N3C)C$C=CC(o)C5Oc1c2C45CC3

Before I forget, this is how we represent atoms in their corresponding SMILES notations.

Atoms
SMILES notation
methane (CH4)
C
water (H2O)
O
hydrogen sulfide (H2S)
S
ammonia (NH3)
N
phosphine (PH3)
P
hydrogen chloride (HCl)
Cl

And this is how a bond is represented in SMILES notation.


Bonds
SMILES notation
single
-
double
=
triple
#
aromatic
:

To master this SMILES notation, u can learn further by clicking here.

Thursday, 21 November 2013

History of the Internet

Assalamualaikum everyone.

I would like to share about the history of internet and it's growth throughout the civilization development.

What Was the "Victorian Internet"?
-The telegraph.
-Invented in the 1840's.
-Used during American Civil War
-Used Morse Code(dots and dashes)

Definition of Internet
A network of networks, joining many government, university and private computers together and providing an infrastructure for the use of E-mail, bulletin boards, file archives, hypertext documents, databases and other computational resources
  • The vast collection of computer networks which form and act as a single huge network for transport of data and messages across distances which can be anywhere from the same office to anywhere in the world.
  • Uses TCP/IP protocols and packets switching.
Brief History of the Internet
Year Progress
1968
DARPA(Defense Advanced Research Projects Agency) contracts with BBN(Bolt,Beranek &Newman) to create ARPAnet 
1974
TCP specification by Vint Cerf
1984
On January 1, the Internet with its 1000 hosts converts en masse to using TCP/IP for its messaging


for more information, click here.


Introduction to XML

Hello Everybody,

Today, we are going to learn about another markup language called XML.

-stands for Extensible Markup Language.
-it is a markup language much like HTML.
-designed to carry data, not to display data
-must define your own tags, as it is not predefined.
-designed to be self-descriptive.


XML
HTML
transport and store data. display data
focus on what data is focus on how data looks
XML is about carrying information HTML is about displaying information

It maybe hard to digest this information but the XML was not design to display, thus it does not really do anything. It was created to structure, store, and transport information.

The following is a good example of storage as XML. It is a note to Adam from Syafiq.

<note>
<to>Adam</to>
<from>Syafiq</from>
<heading>Just A Reminder</heading>
<body>Hakim is coming to your room tonight</body>
</note>

XML is a complement to HTML. It is not a replacement for HTML. In most web applications, XML is used to transport data, while HTML is used to format and display the data. In other words, XML is the calculator, HTML is the computer monitor to display that thing. Well, that might not be the most accurate example, but the understand the ironic.

Example of XML language in action. Hahaha

to learn more about XML, you can visit this page
http://www.w3schools.com/xml/xml_whatis.asp (w3school.com)

That is all for today. With God's will, we will be able to continue our lesson in languages in out next meeting.
Have a nice day!!

 :)


Friday, 15 November 2013

HyperText Markup Language (HTML)

   Assalamualaikum, on the last post we have learned about the Maple Software. Today we will learn about HyperText Markup Language.

HyperText Markup Language.

   HyperText Markup Language, also known as HTML is the authoring language used to create documents on the World Wide Web (WWW). It is the 'mother tongue' of your web browser. HTML is introduced by a scientist named Tim Berners-Lee in 1990 to make it easier for scientists at different universities to gain access to each other's research documents. Nowadays, HTML is mainly used to make websites.

   There are three general components in HTML which is a pair of tags ("start tag" and "end tag"), attributes within the start tag and  any textual and graphical content between the start and end tags. Each tag is enclosed in angle brackets.

Structure of HTML


You can develop HTML in many HTML editors programs such as Microsoft Publisher, Adobe Dreamweaver and even Notepad! Click here for a list of top ten html editor you can use to create web pages.

Now let's see some of the tags available in HTML:

Type of Tag Notation
Paragraph tag <p> element content /<p>
Comment tag <!-- Your Comment -->
Headings tag <h1> to <h6>
Images tag
<img src="(source)" width="(width value)"
height="(height value)" />


You can try to build a webpage using Notepad.
Let's create a simple webpage:
  1. Open Notepad from the Start Menu.
  2. Now try to type this html codes:
<html>
<body>
<p>
An image:
<img src="http://upload.wikimedia.org/wikipedia/commons/8/85/Smiley.svg" alt="Smiley face" width="32"
height="32" />
</p>
<p>
A moving image:
<img src="http://www.rivelazioni.com/immagini_animate/gif_animate/emoticons/love/smiley-7.gif" alt="Computer man" width="48"
height="48" />
</p>
<p>
Note that the syntax of inserting a moving image is no different from a non-moving image.
</p>
</body>
</html>

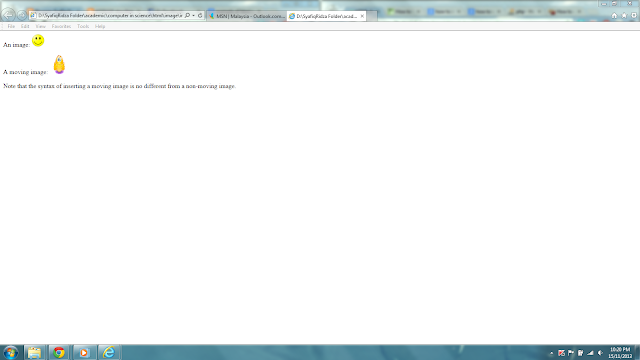
Save your codings as Image.html extension and open the file created. You will get something like this:


Good luck!

Thursday, 7 November 2013

Basic Introduction of Maple


Introduction


       Assalamualaikum, today I'm going to introduce to you about the Maple software - specifically from Physics perspective. Maple is a computer algebra software developed by Maplesoft. It allows users to solve many simple and complex mathematical problems besides improving efficiency of the user in solving calculations.

Figure 1.1 : Maple 16

Applications of Maple


       Maple Software can facilitate you in many ways. First, it helps you to analyze and explore the data. You can make a data analysis from raw data which  may yields into useful information. For example, if you have done an experiment to study the motion of an object, the equations constructed based on the experiment can be analyzed by differentiation and integration to find velocity, acceleration, and time.


Figure 1.2 : A motion experiment


To Do Commands Comments
Arimethic + Add
- Substract
* Multiply
/ Divide
sqrt(a) Take square root of a
^ Raise to a power
abs(a) Take absolute value of a
Clear Maple's memory restart; This does not delete the worksheet. Only Maple's memory is cleared


Table 1 : Example of Maple Commands

       Besides that, you can use Maple to visualize the data you obtained from the experiment conducted or from the functions constructed. This visualizations allows you to extract information in a clearer overview and make conclusion based on the graphical representations. For instance, you can convert a function of a projectile (parabola) into a graph to visualize and extract instantaneous velocity, particular value along the graph, and visualize the effects when you alter the projectile function.

Figure 1.3 : Example of  Graph of a Projectile Motion

Basic Tutorial


You can click this link to view this example of basic Maple tutorial by Bao Nguyen.

I will show you how to use basic commands in Maple.

  1. Open Maple program. Now you are in Document Mode.
  2. Click on File > New > Worksheet mode. This mode allows you to do mathematical calculation with some built-in functions such as surd, simplify, eval, evalf and convert.
  3. Now we will do some basic calculations. Inputting numbers with operations will give you results - just like a normal calculator. For instance, entering 5 + 5 will give you 10, 5 - 5 will give you 0 and so on. It will return answers with exact values (expressed as fractions).
  4. To convert it into significant figures, right click and hover your cursor to Approximate > 5. It will convert the answer into 5 significant figures.
  5. Maple is CASE SENSITIVE! So be cautious on the case you are using to avoid error.
  6. You can also input symbols into the Maple program. On the left panel, you can simply expand the Common Symbols sub-panel and choose the symbol you would like to enter. Alternatively, you can type pre-defined names of the symbol such as "Pi".
  7. To save the worksheet, simply hit Ctrl + S or go to File > Save and finally you can close the program safely.

That is all for today. I hope this entry gives you an idea about the Maple program. Till then, see you soon!